Problem Statement –
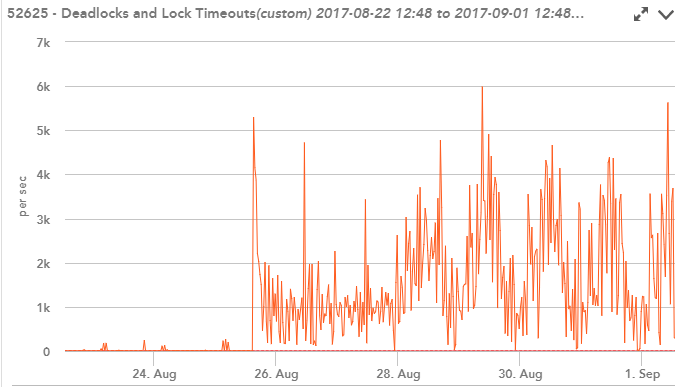
We bumped into a Performance Issue last week for one of our web application in Production and encountered slow response times. After doing some research and looking at Logic Monitor reports for web servers and database servers, we figured out that the Deadlocks and Lock Timeouts in the Database have increased considerably. There was no code that was checked-in during that period which could have increased the database locks. We tried to reproduce and verify this issue in other lower-level environments like DEV, QA and MOCK but were not able to.
We resolved performance issues recently related with ETL jobs causing database locks. I had documented the issue and findings here –
Lock Escalations in SQL Server
The SQL Server Database Engine automatically maintains indexes whenever insert, update, or delete operations are made to the underlying data. Over time these modifications can cause the information in the index to become scattered in the database (fragmented). Fragmentation exists when indexes have pages in which the logical ordering, based on the key value, does not match the physical ordering inside the data file. Heavily fragmented indexes can degrade query performance and cause your application to respond slowly.
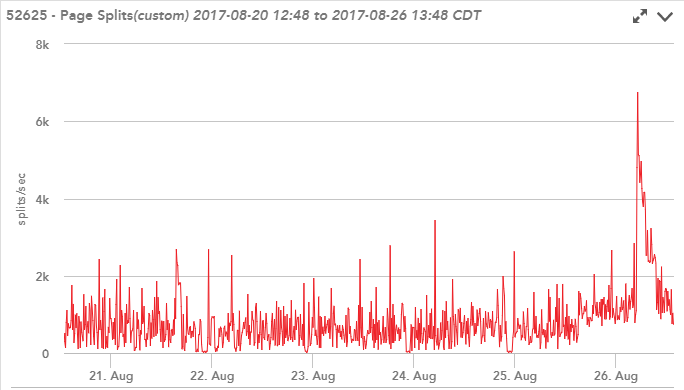
We also saw an increase in the Page Split – indicating that there are fragmented indexes, which is an overhead for Index maintenance.
Indexes get fragmented over a period of time when you do lot of UPDATEs/ INSERTs and DELETEs. You can resolve them by reorganizing the indexes or rebuilding them.
This prompted me to check when the Indexes were last rebuilt.
SQL Server does not store information on when the indexes were last rebuilt. But it does store the information on when the statistics were last updated.
The SQL Server Query Optimizer uses Statistics to determine the execution plan for a query. If statistics are out of date, then the optimizer can make poor decisions on choosing the optimal execution plans.
Below is a query which can help you get information about the last time the statistics was updated on the indexes —
This file contains hidden or bidirectional Unicode text that may be interpreted or compiled differently than what appears below. To review, open the file in an editor that reveals hidden Unicode characters.
Learn more about bidirectional Unicode characters
| SELECT name AS IndexName, | |
| STATS_DATE(object_id, stats_id) AS LastStatisticsUpdate | |
| FROM sys.stats | |
| WHERE object_id = OBJECT_ID('TABLENAME') | |
| and name ='INDEXNAME'; |
After executing the above query, we found that there were many indexes which were not rebuilt since couple of months.
Checking with the Database Team, we figured out that the database was excluded from the nightly Index maintenance Job. As part of a separate weekly load process, the tables were being truncated and indexes were getting rebuilt at that time – however there were lot of other tables which were not part of this load process, and hence all the indexes were not getting rebuilt. In other lower-level environments, the database was included in the nightly index maintenance job and hence the statistics were up to date and we were not able to replicate the performance issues there.
We decided to update the statistics by running a manual SQL script, but later figured out that including the database in the index maintenance job was a better option. The process took an hour to complete, since it was the first time we added the database to the maintenance job. Subsequent runs will be much faster.
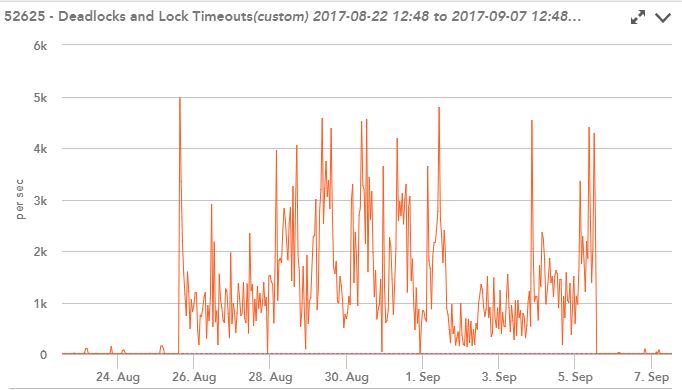
Once we did that, we started monitoring the Logic Monitor Deadlock and Lock Timeouts Graph, and noticed that the number of locks have reduced considerably and we were successful in resolving the issue.
Lessons Learnt –
Fragmented indexes can reduce query performance and can cause your application to respond slowly – something which you need to keep an eye on. You can resolve index fragmentation issues by either reorganizing or rebuilding an index.
You can read more about Reorganizing and Rebuilding Indexes here.
My colleague, Robb Schiefer also wrote a blog post about having the required metrics captured in your system like Google Analytics, Glimpse, Performance Tests, Logic Monitor etc for effectively troubleshooting a performance issue. Read it out here.
Categories: Performance, SQL Server
 Identifying Unused Indexes in SQL Server
  Identify SQL Blocking Issues using Activity Monitor
  Double your Coding Speed using SQL Code Snippets
Thanks, Wilson
LikeLike
awesome use of LogicMonitor !
LikeLiked by 1 person
Thanks Andrey. Logic Monitor has worked great for us while gathering stats around performance issues!
LikeLike