In this blog, we will try to understand the importance of code reviews, classify types of design flaws and identify the code smells using Visual Studio Code Metrics.
Why is Code Review important?
In a development life cycle, Code Reviews play an essential role to gauge the quality of a product.
There are multifold benefits of having a stringent code review in place –
- Finding defects at an earlier stage helps us in avoiding complexities post deployment.
- Complying with coding standards helps us to keep our Technical Debt in check.
But how do we ensure that our review process is efficient? Apart from verifying the functionality, what are the other things a code reviewer needs to look for?
A developer might have made the correct functional changes, but he/she might have violated some fundamental design principles/coding standards.
This makes the role of a Code Reviewer critical. How do we ‘smell’ the various issues with the code?
What is a Code Smell?
In simple terms, we can define it as bad practices or design flaws, which might require attention, either immediately or at a later point of time.
Building up Technical Debt is always a red flag and the earlier we identify and fix issues, the better it is.
Some of the common code smells are —
| Long Method | Keeping our methods short and crisp, makes our code easier to understand and maintain. |
| Duplicate Code | CTRL-C and CTRL-V can be our enemy sometimes. If there is a problem in the original code, we basically end up propagating it across our application. |
| Large Class | Ideally a class should have one responsibility. If we need to add a new functionality, we can rather create a new class than to overload the existing class. |
| Dead Code | In the world of Source Control systems, we don’t need the code which is not being used. |
| Lack of Unit Tests | Having good code coverage gives us confidence that we haven’t broken any existing functionality. |
How to identify these Code Smells?
In Visual Studio, we can identify Code Smells and take decisions to apply the required refactoring. And here comes ‘Code Metrics’ to our rescue.
Code Metrics is a tool which analyzes our project, measures the complexity and provides us better insight into the code.
The Code Metrics Results window is a one stop place which helps us understand how maintainable our code is.
To generate code metrics for our project, we can go to Analyze Menu –> Calculate Code Metrics

What does the Code Metrics Results show?
Be it a developer or a reviewer, Code Metrics helps us identify the places in the code where rework is necessary. It provides us with 5 metrics —
- Maintainability Index – It indicates how easy it should be to understand & modify the code, in a scale of 0 to 100 .High value means better maintainability.
- Cyclomatic Complexity – It indicates the number of possible routes through a unit of code. Less value means better maintainability.
- Depth of Inheritance – It indicates the length of inheritance hierarchy in the class. Less value means better maintainability.
- Class Coupling – It indicates the number of dependencies that an item has. Less value means better maintainability.
- Lines of Code – Lesser the lines of code in a method/class, more is the maintainability.

We can filter the code metrics results based on what we want to see. Also we can export the Code Metrics results to excel.
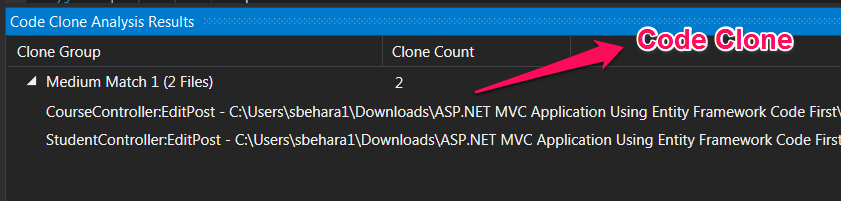
Identify Duplicate Code using Code Clone Analysis
To perform code clone analysis for our project, we can go to Analyze Menu –> Analyze Solution for Code Clones
The Code Clone Analyzer in Visual Studio helps us to search duplicate code in the entire project.
Now that we have an understanding of Code Smells and how to identify their occurrences, the next step is to clean up these code smells – in other words ‘Refactor’.
I will write a follow up blog and show how to refactor & improve code quality by following some simple options in Visual Studio 2015 IDE.
I would also recommend you to go through my previous blog on SonarQube – which is a great tool for inspecting code quality and can be used for performing Code Reviews as well —
Manage your Technical Debt with Visual Studio 2015 and SonarQube
Categories: C#, Performance, Visual Studio
 Enhance Developer Productivity with CodeLens Code Health Indicator
  Manage your Technical Debt with Visual Studio 2015 and SonarQube
  Increase your Coding Speed using Code Snippets in Visual Studio
  Performance Analysis using PerfTips in Visual Studio 2015
Leave a Reply