How many times have you tried to troubleshoot a TSQL performance issue and wished you had more statistical/historical information on how the query ran over a period of time?
How many times have you faced performance issues after server/application upgrades? How many times have you bumped into a temporary performance issue with a TSQL and you wonder what is causing the query to run slow all of a sudden?
In this article, we will look at an exciting new feature in SQL Server 2016 called as ‘Query Store’ and how it can help us in troubleshooting performance issues.
What is Query Store?
Query Store is a new feature in SQL Server 2016 which collects and presents detailed historical information of queries, execution plans and run-time statistics. This feature gives the SQL developers/DBAs lot more control and insight into the query performance issues.
One of the best things about Query Store is that it is directly integrated in SQL Server, so gives more power to developers/DBAs to have an access to run-time query statistics.
Query Store is simple to use and has a graphical user interface built into SSMS. Data is captured in the user database itself, so the information is all available right away and need not be mined, as with any 3rd party performance monitoring tool.
What does the Query Store do?
- Stores the history of execution plans for each query.
- Stores the performance statistics of each query over a period of time.
- Helps in analyzing the query workload pattern.
- Helps to baseline performance metrics and compare the query execution with the deviation from baseline.
- Displays customizable UI reports showing top resource consuming queries in terms of CPU Time, Duration, Physical/Logical Reads, Memory Consumption etc.
- Forcing an execution plan with optimal performance to be used.
- Diagnosing performance issues after server/application upgrades.
How does Query Store work?
From an architecture standpoint, the query store contains two stores —
- Plan Store
- Runtime Stats Store
When we run a TSQL Query against our SQL Database, with Query Store enabled, the execution plan information is stored into the Plan store and the execution statistics information into the Runtime Stats store.
DMVs vs Query Store
Generally we use Dynamic Management Views to monitor the health of a database server, diagnose problems and get better insights into how the SQL Server works.
DMVs can provide us with lot of information like the query’s cached plan, what indexes are used, what are the missing indexes, how much time was spent executing a query, how much time was spent waiting on other resources, how much I/O occurred (both physical and logical) and more.
However all these information clear out whenever SQL Server gets restarted or the plan cache is cleared.
Query Store stores all information on disk, and as a result the data persists across server restarts, upgrades and recompiles.
How to enable and configure Query Store?
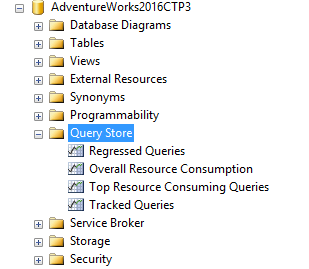
Query Store is a Database level configuration and by default it is turned OFF. Within your SQL Server 2016 database, you will now see a new folder named ‘Query Store’. Expanding it you will see 4 reports –
Operation Mode – Off, Read Only, Read Write- Requested query store operation mode.
Data Flush Interval – Frequency at which the data is flushed and persisted to disk.
Statistics Collection Interval – Frequency at which run-time statistics are collected.

Max Size – Maximum size allocated to the query store within the host database.
Query Store Capture Mode – All/None/Auto – Captures all or selective queries.
Size Based Cleanup Mode – Auto/Off – Activates data clean up automatically when total amount of data reaches maximum size.
Stale Query Threshold – Duration to retain run-time statistics.
Is there any Performance Impact of storing query statistics on the disk ?
Ideally you should not be seeing any performance degradation by storing the query statistics inside the database. However you need to be aware of a couple of configuration settings related with Query Store –
Data Flush Interval – By default it is set as 15 min. Reducing this interval further would indicate writing to the disk faster, and might have an impact on performance.
Max Size – You can allocate a max size to the Query Store within the application database. Once you go over that limit, you can use Query Store as ‘Read Only’ and not ‘Read Write’ mode.
Quick look at the new Query Store related DMVs
For supporting the Query Store feature, there is a list of new DMVs introduced in SQL Server 2016. These DMVs are used primarily to display the various built-in reports inside the Query Store.
sys.database_query_store_options – Contains information on the Query Store options for the database.
sys.query_store_plan – Contains information about the execution plans for a query.
sys.query_store_query – Contains information about the query and its aggregated runtime statistics.
sys.query_store_query_text – Contains the Transact-SQL text.
sys.query_store_runtime_stats – Contains information about the query runtime statistics.
sys.query_store_runtime_stats_interval – Contains information about the start and end time of each interval over which statistical information for a query was collected.
What are the various built in Query Store reports?
Regressed Queries – Shows all the queries whose Execution Plan worsened over a period of time.
Overall Resource Consumption – Shows summary of the query runtime statistics executed during a time interval.
Top Resource Consuming Queries – Shows most expensive queries executed during a time interval, based on Duration, CPU Time, Logical/Physical Reads, Memory consumption.
Tracked Queries – Shows the historic runtime statistics of a specific query.
In my next blog post, I will be talking about these Query Store reports in detail.
Also read –
Categories: SQL Server
 Learn Azure SQL
  SQL Saturday Birmingham 2019
  Speaking at SQL Saturday Jacksonville 2019
  My Favorite Feature in Azure Data Studio
Thanks for writing such a beautiful article.
LikeLiked by 1 person
You are welcome Rupesh. Glad you liked it.
LikeLike
Many thanks to writing this article
LikeLiked by 1 person
Thanks Chandu for your feedback. Appreciate it.
LikeLike