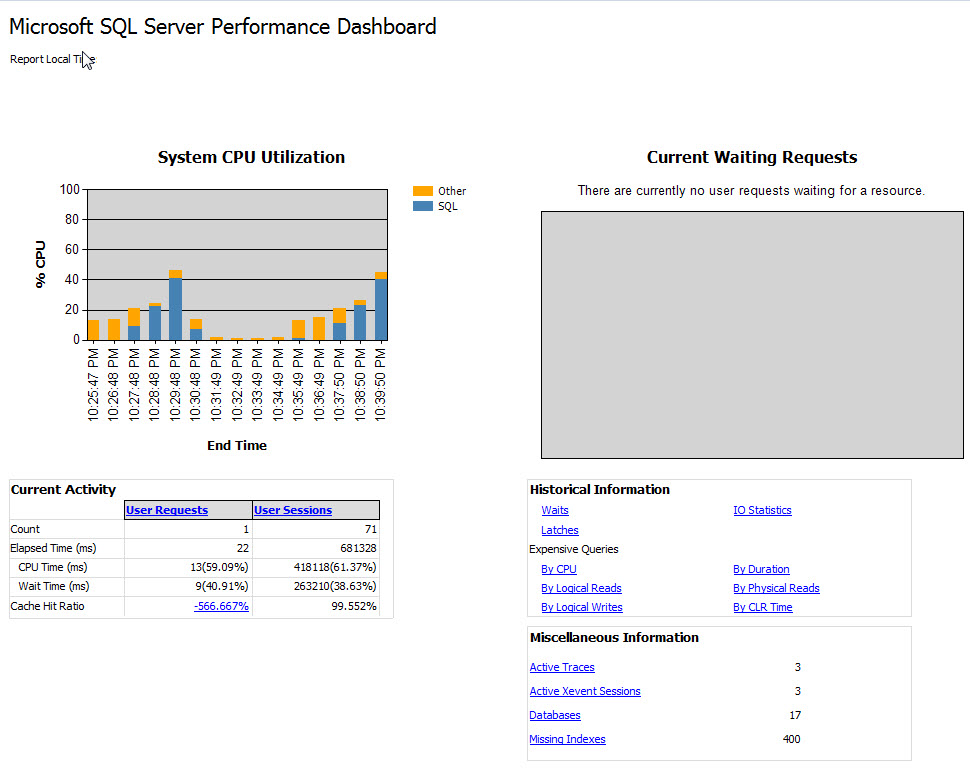
SQL Server Performance Dashboard Reports are used to monitor and resolve performance issues in your Database Server. They are generally targeted towards a Database Administrator, and enabling them to quickly identify any performance bottlenecks in the system, gather diagnostic information that can potentially help to resolve the issue. All the information is retrieved from Dynamic Management Views.
Before SSMS 17.2, it required a separate download and install process for the Performance Dashboard Reports. With the new SSMS 17.2, the Performance Dashboard are now embedded as a built in Standard Report.
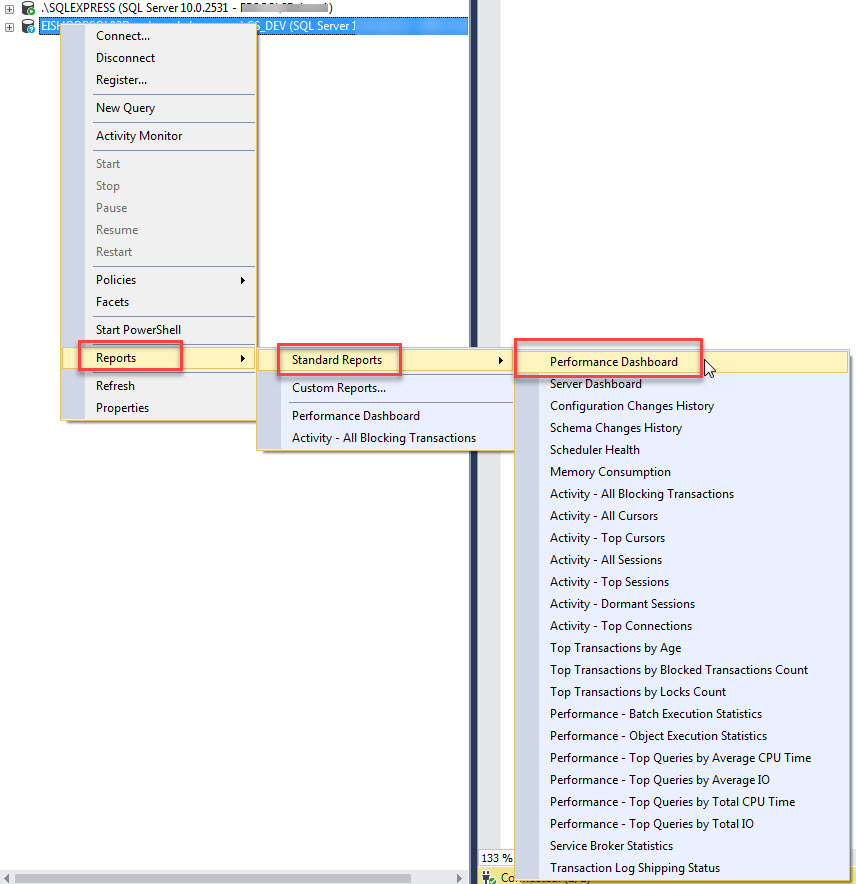
To access the reports, Right Click on the Database –> Go to Reports –> Go to Standard Reports –> Performance Dashboard
Common performance problems that the dashboard reports may help to resolve include:
– CPU bottlenecks (and what queries are consuming the most CPU)
– IO bottlenecks (and what queries are performing the most IO)
– Index recommendations generated by the query optimizer (missing indexes)
– Blocking
– Latch contention
By clicking on the respective links below, you can gather detailed information and recommendation for your workload.
SSMS provides a number of standard database level reports out of the box for performance monitoring and troubleshooting purpose. The best thing about these reports are that it encapsulates all the complexity behind generating them. The information is extracted from the DMVs, however you need not execute T-SQL queries to get this information.
Read more about the Performance Dashboard Reports here.
Categories: SQL Server, SQL Server 2017
 Microsoft SQL Operations Studio – Color Themes and Customization
  Getting started with Microsoft SQL Operations Studio
  Getting started with Microsoft SQL Server 2017
  My PASS Summit 2017 Experience
Leave a Reply