Coming back after a long weekend – on a Monday morning, we found one of our services to be down in our Test environment.
Looking at the server event logs, we found the error message in the stack trace – ‘System.Data.SqlClient.SqlException: Login failed for user‘.
We tracked the issue back to a service account which got removed from the database. Once we added the account, the service was up and running.
Now the next obvious question was who/when/why made the change to the service account? Did someone manually make the change or was it caused by a deployment? Was the change intentional or just a mistake?
While troubleshooting issues, viewing the SQL Server logs is beneficial since it contains information about user-defined events and also few system events.
You will be able to find information like – when the SQL Server instance has stopped and restarted, Memory issues, Login Failures or any other potential issues. However I did not find any information relating to adding/deleting user accounts or user permission changes on a SQL Instance.

So I shifted my focus and started looking at the default trace in SQL Server.
The default trace provides lot of information about the security and health of your SQL Server instance. It is a great resource to track changes made to your SQL instance and can be used for auditing purpose.
By default, the SQL Server Default Trace is enabled and is present in the SQL Server installation directory.
Default Trace provides detailed information on the Security/Audit Events —
This file contains hidden or bidirectional Unicode text that may be interpreted or compiled differently than what appears below. To review, open the file in an editor that reveals hidden Unicode characters.
Learn more about bidirectional Unicode characters
| –List all Security Audit Events | |
| DECLARE @id INT; | |
| SELECT @id = id | |
| FROM sys.traces | |
| WHERE is_default = 1; | |
| SELECT DISTINCT eventid AS 'EventID' , | |
| name AS 'Event Name' | |
| FROM fn_trace_geteventinfo(@id) GEI | |
| JOIN sys.trace_events TE ON GEI.eventid = TE.trace_event_id | |
| WHERE name LIKE '%Audit%'; |
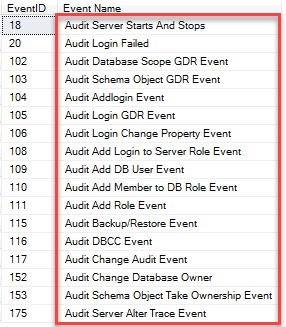
Below is the list of Audit events which you can look at —
You can execute the below script to find the security changes in your database –
This file contains hidden or bidirectional Unicode text that may be interpreted or compiled differently than what appears below. To review, open the file in an editor that reveals hidden Unicode characters.
Learn more about bidirectional Unicode characters
| DECLARE @tracefile VARCHAR(256) | |
| SELECT @tracefile = CAST(value AS VARCHAR(256)) | |
| FROM ::fn_trace_getinfo(DEFAULT) | |
| WHERE traceid = 1 | |
| AND property = 2 — filename property | |
| SELECT * | |
| FROM ::fn_trace_gettable(@tracefile, DEFAULT) trc | |
| INNER JOIN sys.trace_events evt ON trc.EventClass = evt.trace_event_id | |
| WHERE trc.EventClass IN (102, 103, 104, 105, 106, 108, 109, 110, 111) | |
| ORDER BY trc.StartTime |
However do keep in mind that SQL Server by default has five trace files. If you have a busy system, the trace files may roll over far too fast and you may not be able to view some of the changes.
Reference articles
Find Permission Changes In The Default Trace
Categories: SQL Server
 Learn Azure SQL
  SQL Saturday Birmingham 2019
  Speaking at SQL Saturday Jacksonville 2019
  My Favorite Feature in Azure Data Studio
Leave a Reply