Spring is widely used by developers to create enterprise applications in Java. Spring Boot assists developers to encapsulate lot of the complexity associated with the Spring framework. You can quickly get started with development without the need of any boilerplate configuration.
Spring Boot provides a library called as Actuator, which provides Production ready endpoints out of the box, without the need of any additional coding. These endpoints can be used for monitoring your application and exposing operational information about your application like health, metrics, trace, info, dump, mappings, beans, auditevents and more.
Generally for exposing an endpoint, you will need to write your own custom controller containing the functionality. But the cool thing about Actuator is that new endpoints are added to your application without you writing any controller code. All you need to do is add the Actuator dependency in your application, and out of the box it will make a number of endpoints available to monitor your application and gather metrics.
You can spin up a Spring Boot application with the required dependencies in no time using the Spring Initializr here – http://start.spring.io

Spring Boot Actuator will auto-configure all enabled endpoints to be exposed over HTTP.
Endpoints are setup automatically. You can also customize the endpoints as per your application requirements.
You can view all the built-in endpoints provided by Actuator here —
https://docs.spring.io/spring-boot/docs/current/reference/html/production-ready-endpoints.html
Most of the information returned by these end points are sensitive in nature and needs to be accessed by authorized users only. For example you do not want to expose the database or mail server details to the outside world. By default, only the health and info status is exposed over an unauthenticated HTTP connection.
Since there are multiple endpoints which display sensitive information, you will need to change the security mode to view those information.
I spun up a demo web application and tried to access the trace endpoint and got the below authentication error —
{
“timestamp”: 1516932131253,
“status”: 401,
“error”: “Unauthorized”,
“message”: “Full authentication is required to access this resource.“,
“path”: “/trace”
}

Full authentication is required to access actuator endpoints. Consider adding Spring Security or set ‘management.security.enabled’ to false.
To address this issue, add the below code to your application.yml file —
management:
security:
enabled: false
Setting management.security.enabled=false in the application.yml file will disable the security on the endpoints.
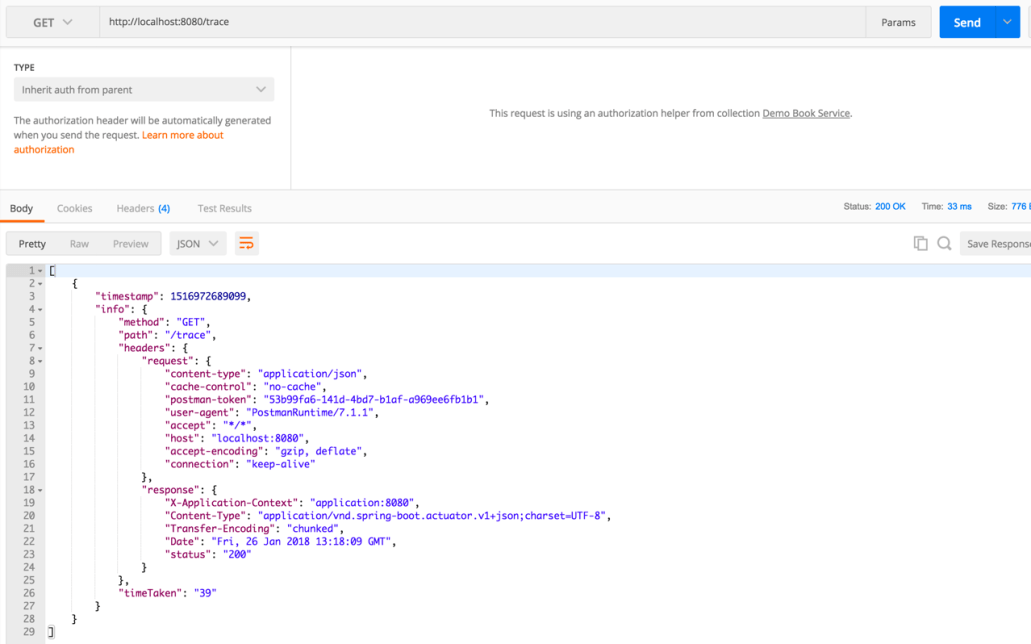
YAML has a very convenient format for specifying hierarchical configuration data. But one thing to keep in mind is that that indentation matters to denote the Parent level property. Once you specify the configuration, you will be able to access the default trace endpoint exposed by Actuator —
Conclusion —
For application monitoring and metrics gathering, you should use Actuator in your Spring Boot projects – multiple built-in endpoints without the need of any additional coding. Isn’t it awesome?
I found this article to be a good resource if you want to learn more about Actuator.

Expose to public so people can restart your system at anytime?
LikeLike