Prometheus is an open source metrics-based monitoring and alerting system. In 2016 the Prometheus project became the second member of the Cloud Native Computing Foundation, after Kubernetes. It has a powerful query language(PromQL) with a multidimensional data model suited to store time series data. In the Cloud Native space, there are a number of tools which provides information around observability. Please note that Prometheus is just focused on the Metrics space. It does not perform Logging, Tracing or Anomaly Detection.
You can use Prometheus as a time series database to store metrics for observability. It is a Pull based monitoring system in which you need to specify where to scrape the metrics. It polls at a periodic interval from all the clients and stores it in the disk. Prometheus gives you the flexibility of alerting on any custom alerting scenarios you have. You can write your own alerts based on the Prometheus metrics.
Prometheus Monitoring can be categorized as Whitebox Monitoring.
Blackbox Monitoring can be defined as system monitoring from the outside, without any knowledge of how the system works internally. Say for example – Ping, HTTP request etc.
Whitebox Monitoring works with information from inside your systems like CPU/Memory consumption, Number of requests, Response Times etc.
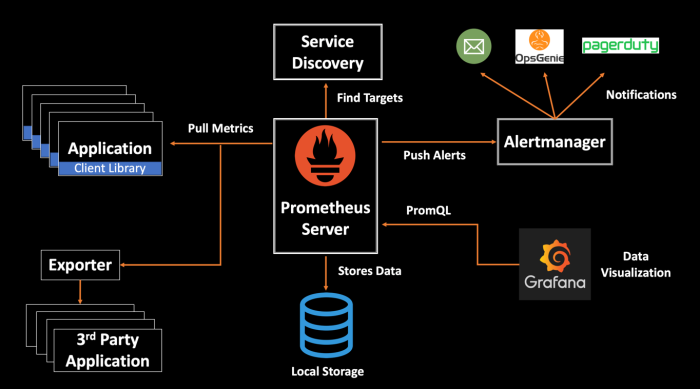
Prometheus Architecture
Prometheus identifies the applications it needs to monitor via Service Discovery. These applications can be your own instrumented applications or 3rd Party applications you can scrap via an Exporter. The scraped data is stored in local storage and you can query it directly using PromQL or view it via Grafana dashboards. You can configure the alerting rules in the Prometheus server which Prometheus will periodically evaluate the collected data. It sends alerts to AlertManager which aggregates alerts over time and groups/sends a notification to different notification systems like OpsGenie, Pagerduty, Email etc.
Alerting with Prometheus is categorized into two parts —
- Alerting rules in Prometheus servers send alerts to Alertmanager.
- The AlertManager then manages those alerts, including silencing, inhibition, aggregation and sending out notifications via methods such as email, PagerDuty and OpsGenie.
Client Libraries
Client libraries help in pulling metrics from the applications and send it to the Prometheus Server as direct instrumentation. Prometheus project provides client libraries in a number of languages like Python, Java, Go and Ruby. There are client libraries for C#, Node.js available as third-party components for instrumenting application code.
Exporters
For applications where you cannot add direct instrumentation, you can use an Exporter to deploy right beside your application you want to pull metrics from. It takes in the request from Prometheus server, gathers the required data from the applications, transforms them into the correct format and sends a response back to Prometheus server in the desired format.
Service Discovery
Service Discovery plays a key role in dynamic environments. Prometheus has integrations with many popular service discovery tooling like Kubernetes, AWS EC2, Consul etc. This enables Prometheus to identify the applications it needs to monitor and pull metrics from.
Scraping
Prometheus regularly sends an HTTP request called a ‘scrape’ to the applications it wants to monitor & fetch metrics. The response to the scrape is parsed and ingested into the local storage. ‘scrape_interval’ is the frequency in which Prometheus can poll and gather metrics from the target. Scraping happens at a frequent interval of 10-60sec.
Local Storage
The primary responsibility of the Local Storage is to store the data locally in a custom data store. It needs to handle the ingestion of millions of sample per second. To keep things simple and reliable, Prometheus data storage does not deal with clusters or replicas since it makes operations a bit complex. You can also configure long term storage to have an extended data retention period.
Data Visualization
Grafana is the leading open source software for time series analytics. It allows you to query, visualize and understand your metrics. Grafana has native Prometheus support, but does support a large number of databases like Elasticsearch, AWS Cloudwatch, InfluxDB, Graphite etc. it comes with a large number of inbuilt reusable dashboards to bring your data together and share it.
Alertmanager
The primary responsibility of Alertmanager is to receive alerts from the Prometheus Server and turn them into notifications. However, it is not a dumb component which blindly translates alerts into notifications. It has a number of features which makes the alerting process more consistent and effective —
- Grouping alerts of similar nature so that a large number of alerts are not sent across during a large system outage.
- Throttling is in place to reduce the number of notifications sent to the receiver integration system.
- Inhibition of alerts. Inhibition is a concept of suppressing notifications for selected alerts if related alerts are already firing.
- Silencing of alerts. Silencing is basically a way to mute alerts for a given time.
- Alerts can be sent to a number of systems like OpsGenie, PagerDuty, Email, Chat applications.
Additional Prometheus Resources for reference —
Categories: Architecture, Cloud Native, Microservices, Prometheus

Very Crisp writeup Samir! Thank you
LikeLike