In this article, I will show you how to simulate traffic to your Kubernetes cluster using a tool called Siege and then verify the increased traffic/load using Prometheus.

Siege is an excellent open source command line tool to get started with load testing your application. It allows you to hit a webpage in your server with a configurable number of simulated users. It evaluates the amount of Data Transferred, Response time of the server, Transaction Rate, Throughput, Concurrency, Failed Transaction count, Average duration of the transactions.
Siege can help you to simulate traffic as well let you know how much traffic your application can handle. It is great for Performance Testing as well.
Prometheus is an open-source tool for monitoring your system. You can determine the overall health and metrics of your Kubernetes cluster by querying Prometheus.
PromQL is the Prometheus Query Language. It allows for a wide range of operations including aggregation, slicing and dicing, prediction and joins.
Siege Github Repo –
https://github.com/JoeDog/siege
Siege can be installed in MacOS via Homebrew —
$ brew install siege
There are a number of options which you can use to make your tests mimic a real world production environment.
$ siege –help
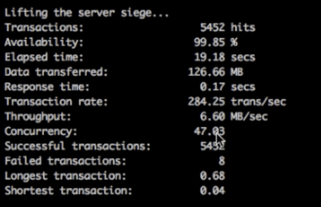
Now let us create a sample test using Siege. Let us simulate 50 users hitting the ProductPage simultaneously, with no delay between request and for a total time period of 20 seconds –
siege -c50 -b -t20S testwebsite.com/productpage
Next let us open the Prometheus UI. Let us execute the port forward it to my localhost port 9090 —
kubectl -n istio-system port-forward $(kubectl -n istio-system get pod -l app=prometheus -o jsonpath='{.items[0].metadata.name}’) 9090:9090 &
Let’s open http://localhost:9090/graph in the web browser.
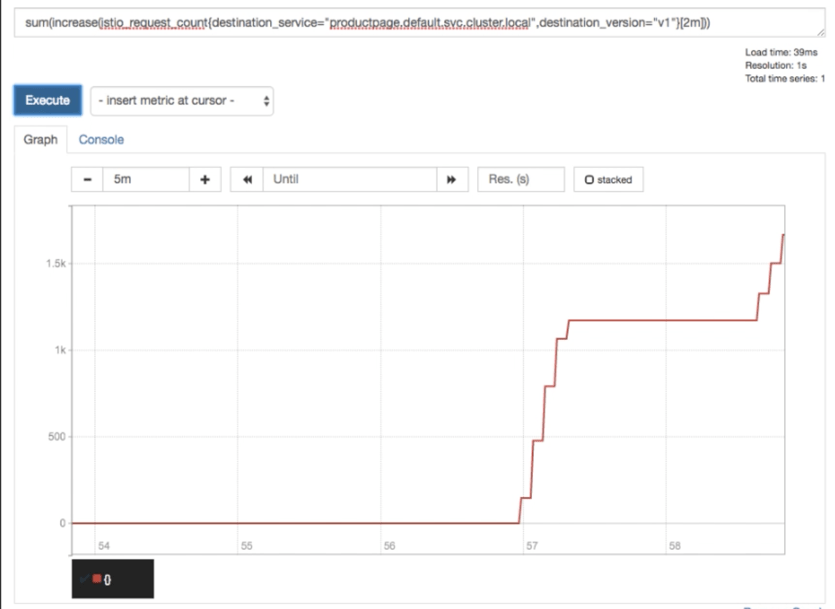
Let us now execute a Prometheus Query to verify the total count of requests to the ProductPage —
sum(increase(istio_request_count{destination_service=”productpage.default.svc.cluster.local”,destination_version=”v1″}[1m]))
As expected, you see a spike in the requests once the Siege query was executed —

Performance Testing with Siege
You can get a quick overview of your application performance, by running Siege with a different number of concurrent users and compare the results – say ‘response time’.
siege -c50 -b -t10S testwebsite.com/productpage
siege -c10 -b -t10S testwebsite.com/productpage
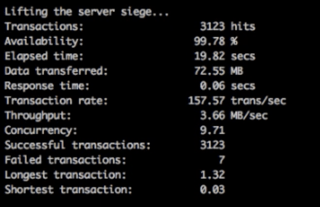
From the summary results above, you can see that as the number of concurrent users decreased from 50 to 10, the response time of the application improved from 0.17 sec to 0.06 sec.
The Prometheus graph correctly shows the spike in traffic when the above command is run to generate traffic.
In this article, I demonstrated how to quickly load test and performance test your application using Siege and verify the increased traffic in Prometheus. Let me know if you have any questions on this by adding a comment below, and I would be happy to discuss.
Categories: Kubernetes, Load Testing

Leave a Reply